Section 4 Case Study: Jordan
Some significant applications are demonstrated in this chapter.
4.1 Establishments in Jordan
4.1.1 Source of the Jordan IO table
The Jordanian Department of Statistics (DoS) has produced a Jordanian Input-Output table (JOIT) with the assistance of international donors such as the US, EU, and others. These I-O tables are not directly published by the department, but secondary sources such as the USAID Siyaha project have made some of the major components available in public reports. This makes it possible to reverse-engineer the main components of the input-output flow table, albeit at a less granular level. For example, whereas the original DoS input-output table allegedly breaks out the table by 81 sectors, the Siyaha table does so by 23 sectors.
If the full IO flow table was made available to LENS, a LENS-specific sector grouping could be created instead of the 23 sectors created by Siyaha. Additionally, if the IO flow table provides separate line items for wages, profits, and tax (components of value-added), indirect jobs could be estimated as a function of the net changes in wages instead of gross output.
4.2 Multiplier Analysis
## Warning in left_join_impl(x, y, by$x, by$y, suffix$x, suffix$y): joining
## character vector and factor, coercing into character vector
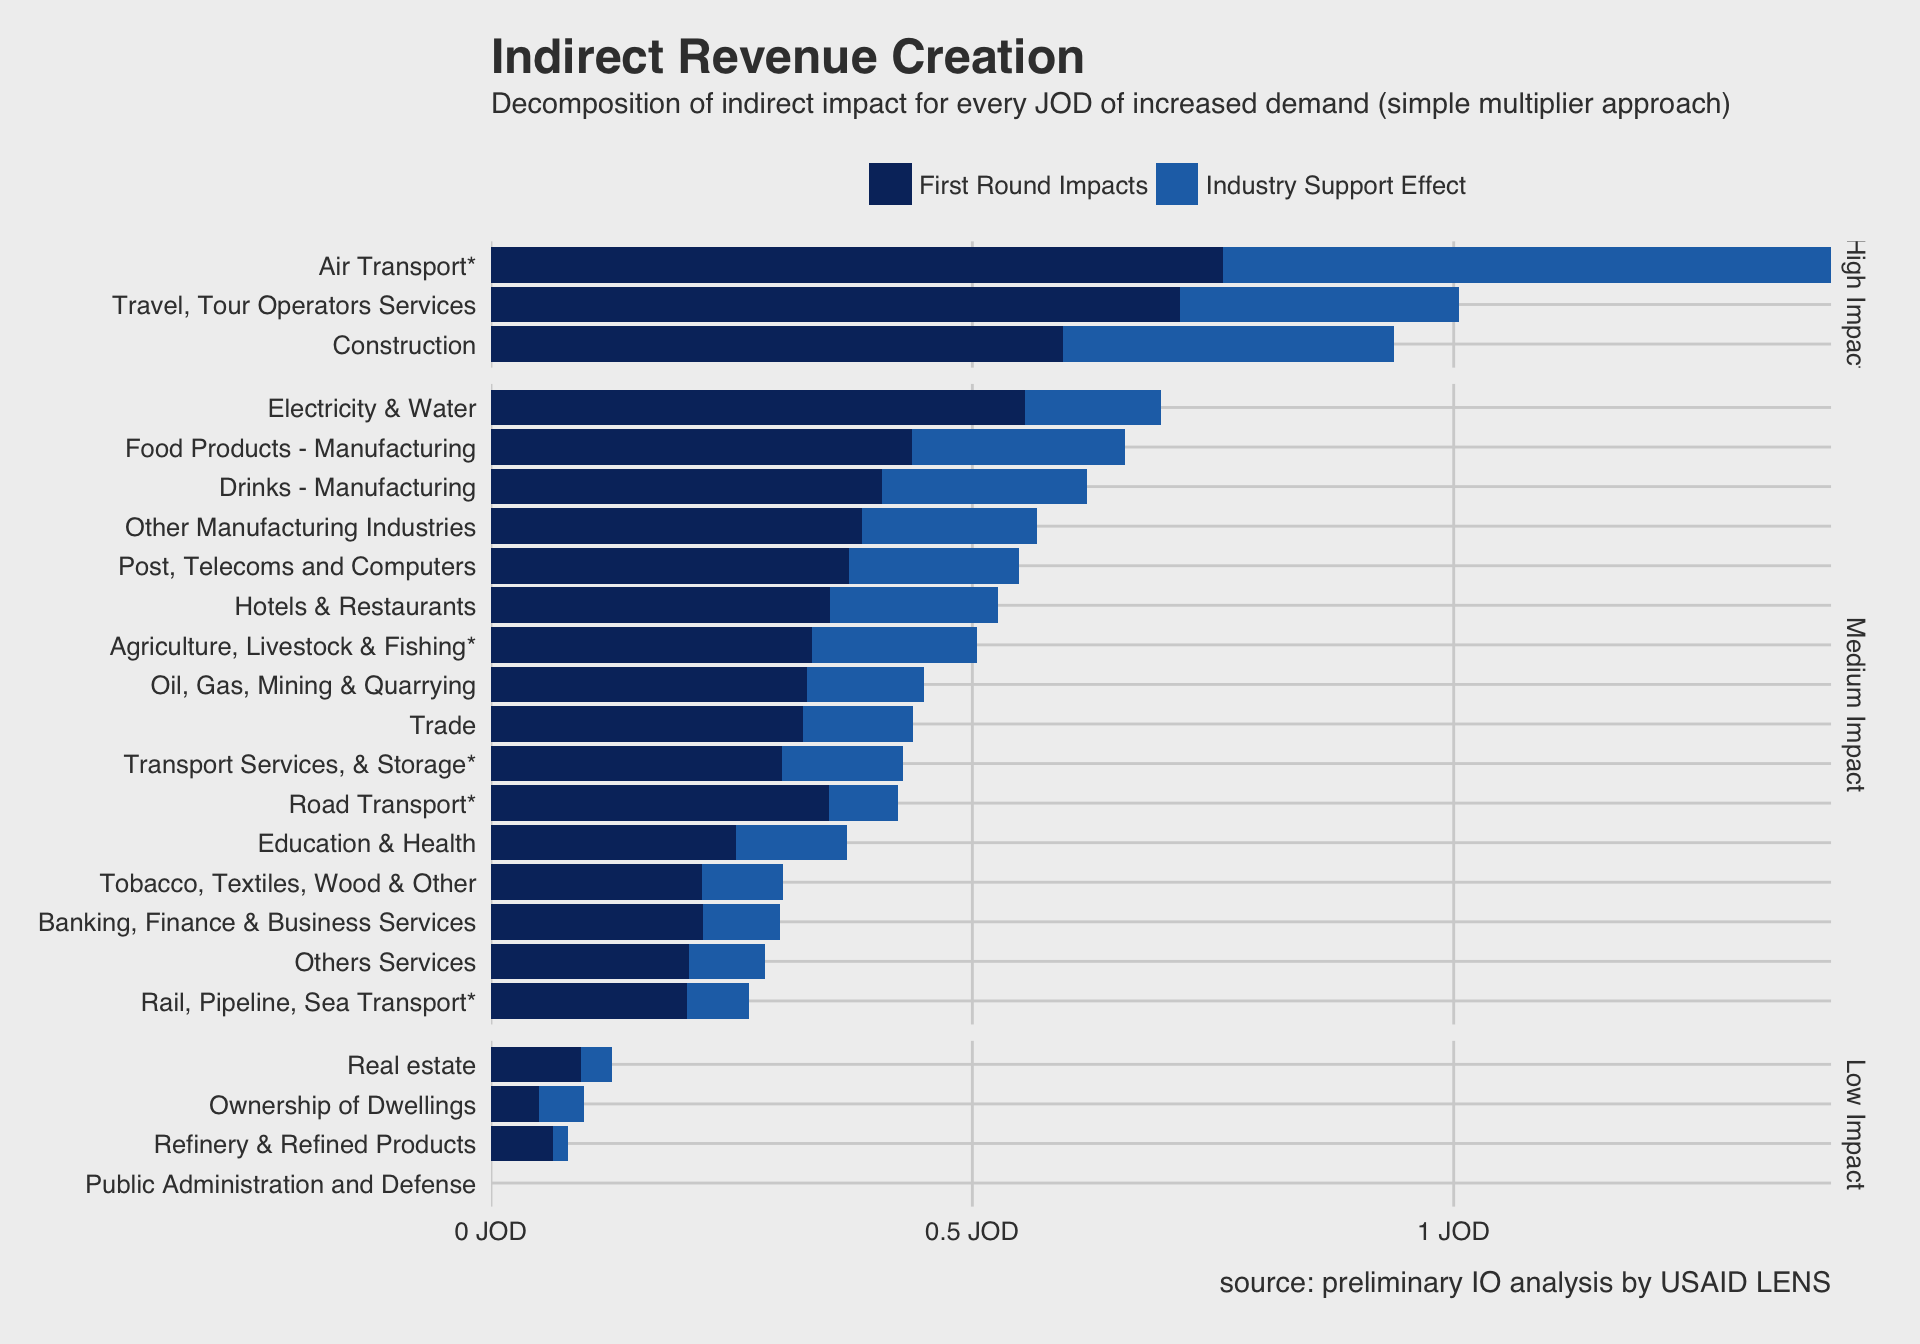
Figure 4.1: Indirect revenue created in Jordan for every dinar increase of final demand
Figure 4.1 show that in general, every dinar of increased demand will generate a maximum of two dinars of additional impact in the value chain. Sectors such as public administration are expected to create no indirect impact.
A common terminology exists that describes components of simple multipliers. First round impacts are value-chain impacts are those that arise from direct vendors in order to create the needed increase input.9 Industrial support effects represent the difference between the initial impact and the first round effects.10 Together, these two components of indirect impact are called production-induced effects.

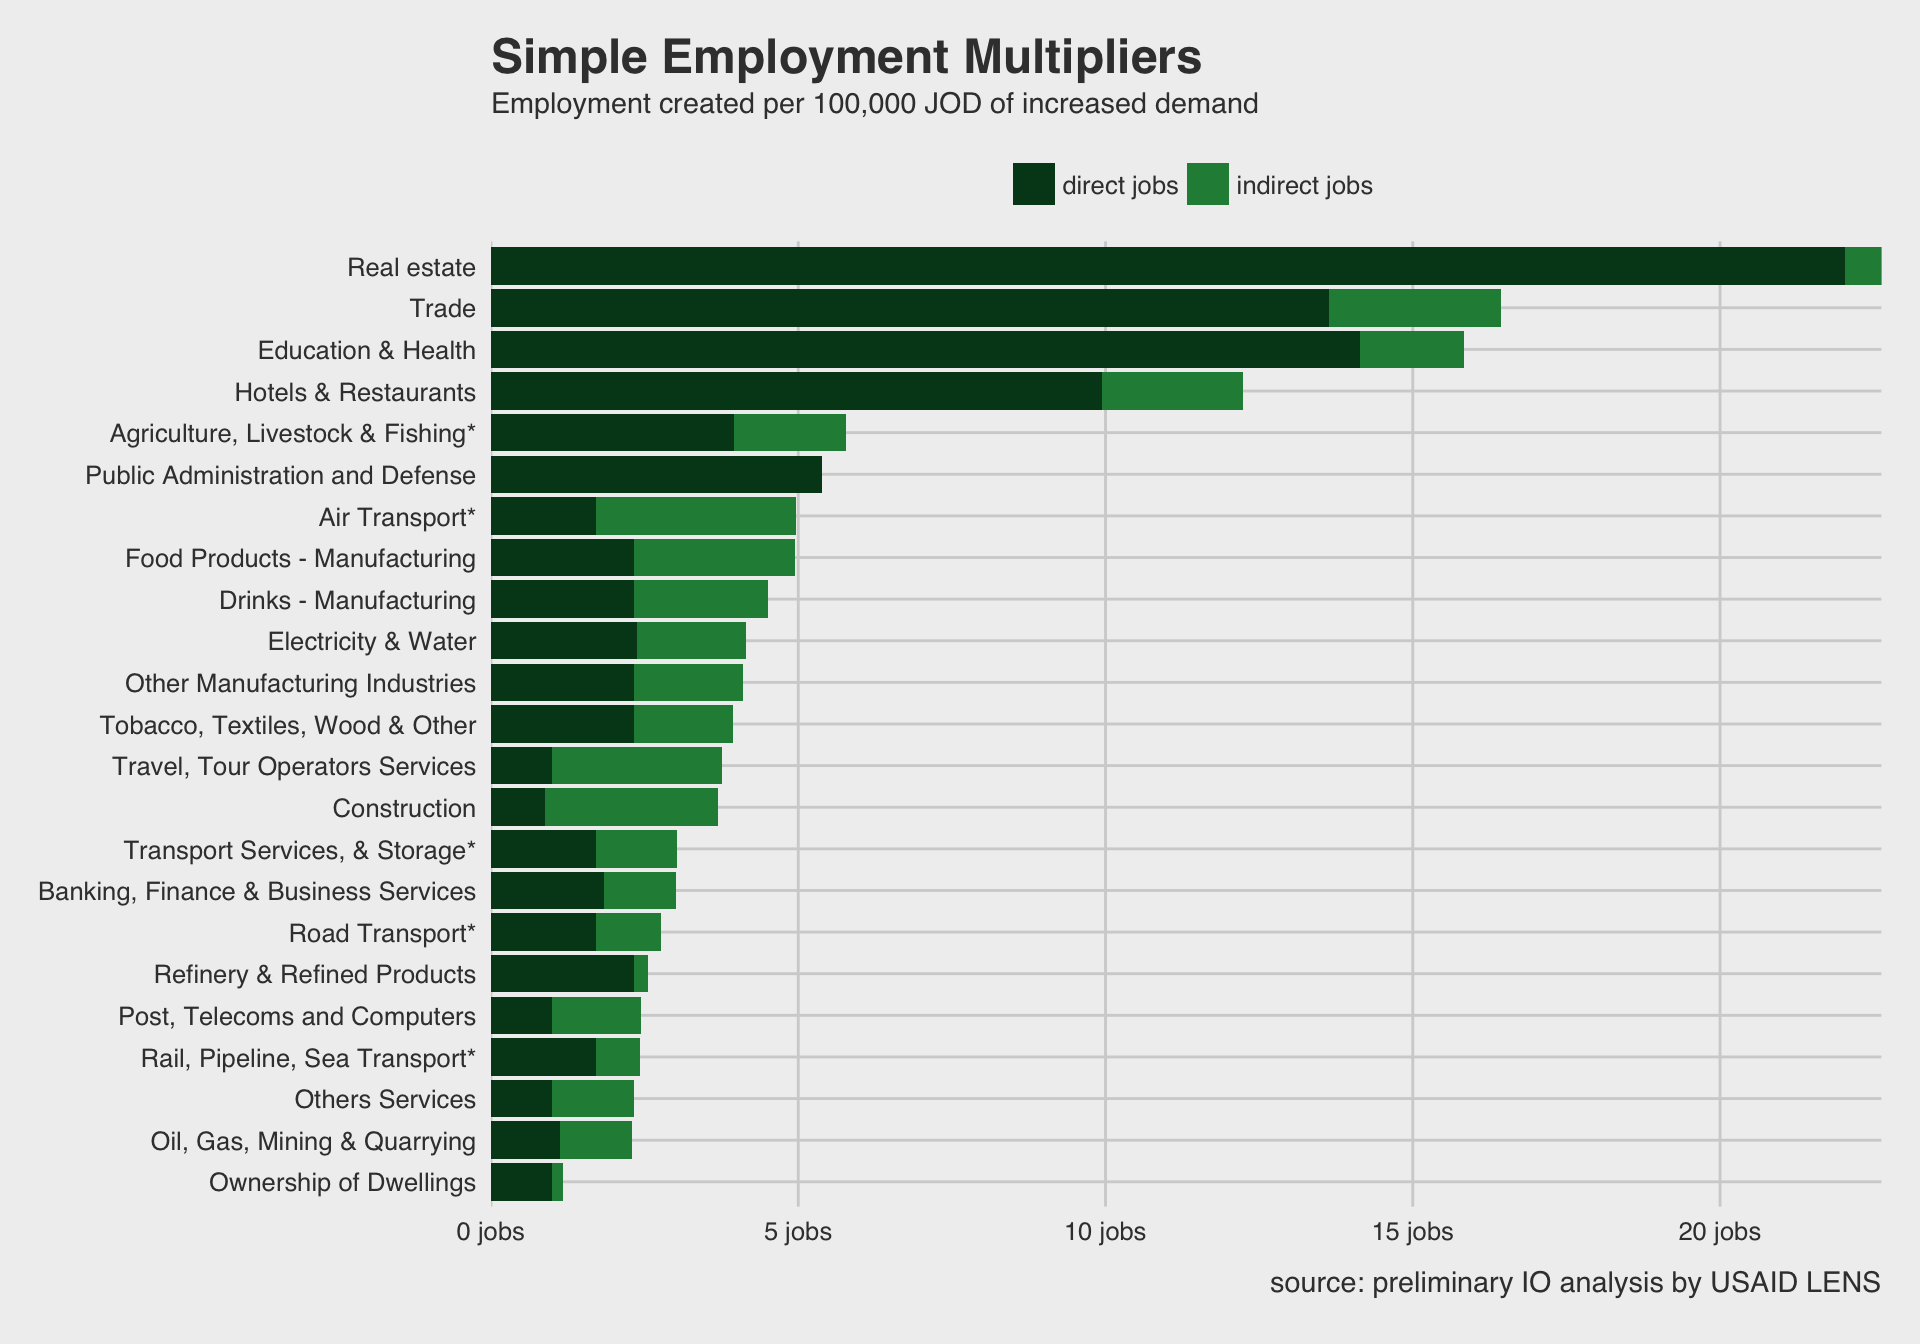
Figure 4.2: Simple employment multipliers for given sectors in Jordan
Indirect job creation is generally minimal in comparison to direct job creation. The sectors that produce a larger relative share of indirect jobs (out of the total job impact) tend to create fewer jobs to begin with. This points to a trend generally observed in employment impact analysis, which is that there is a negative relationship between indirect job creation and value-added job creation:. A focus on value-added sectors will create fewer jobs for every dinar, and vice versa.

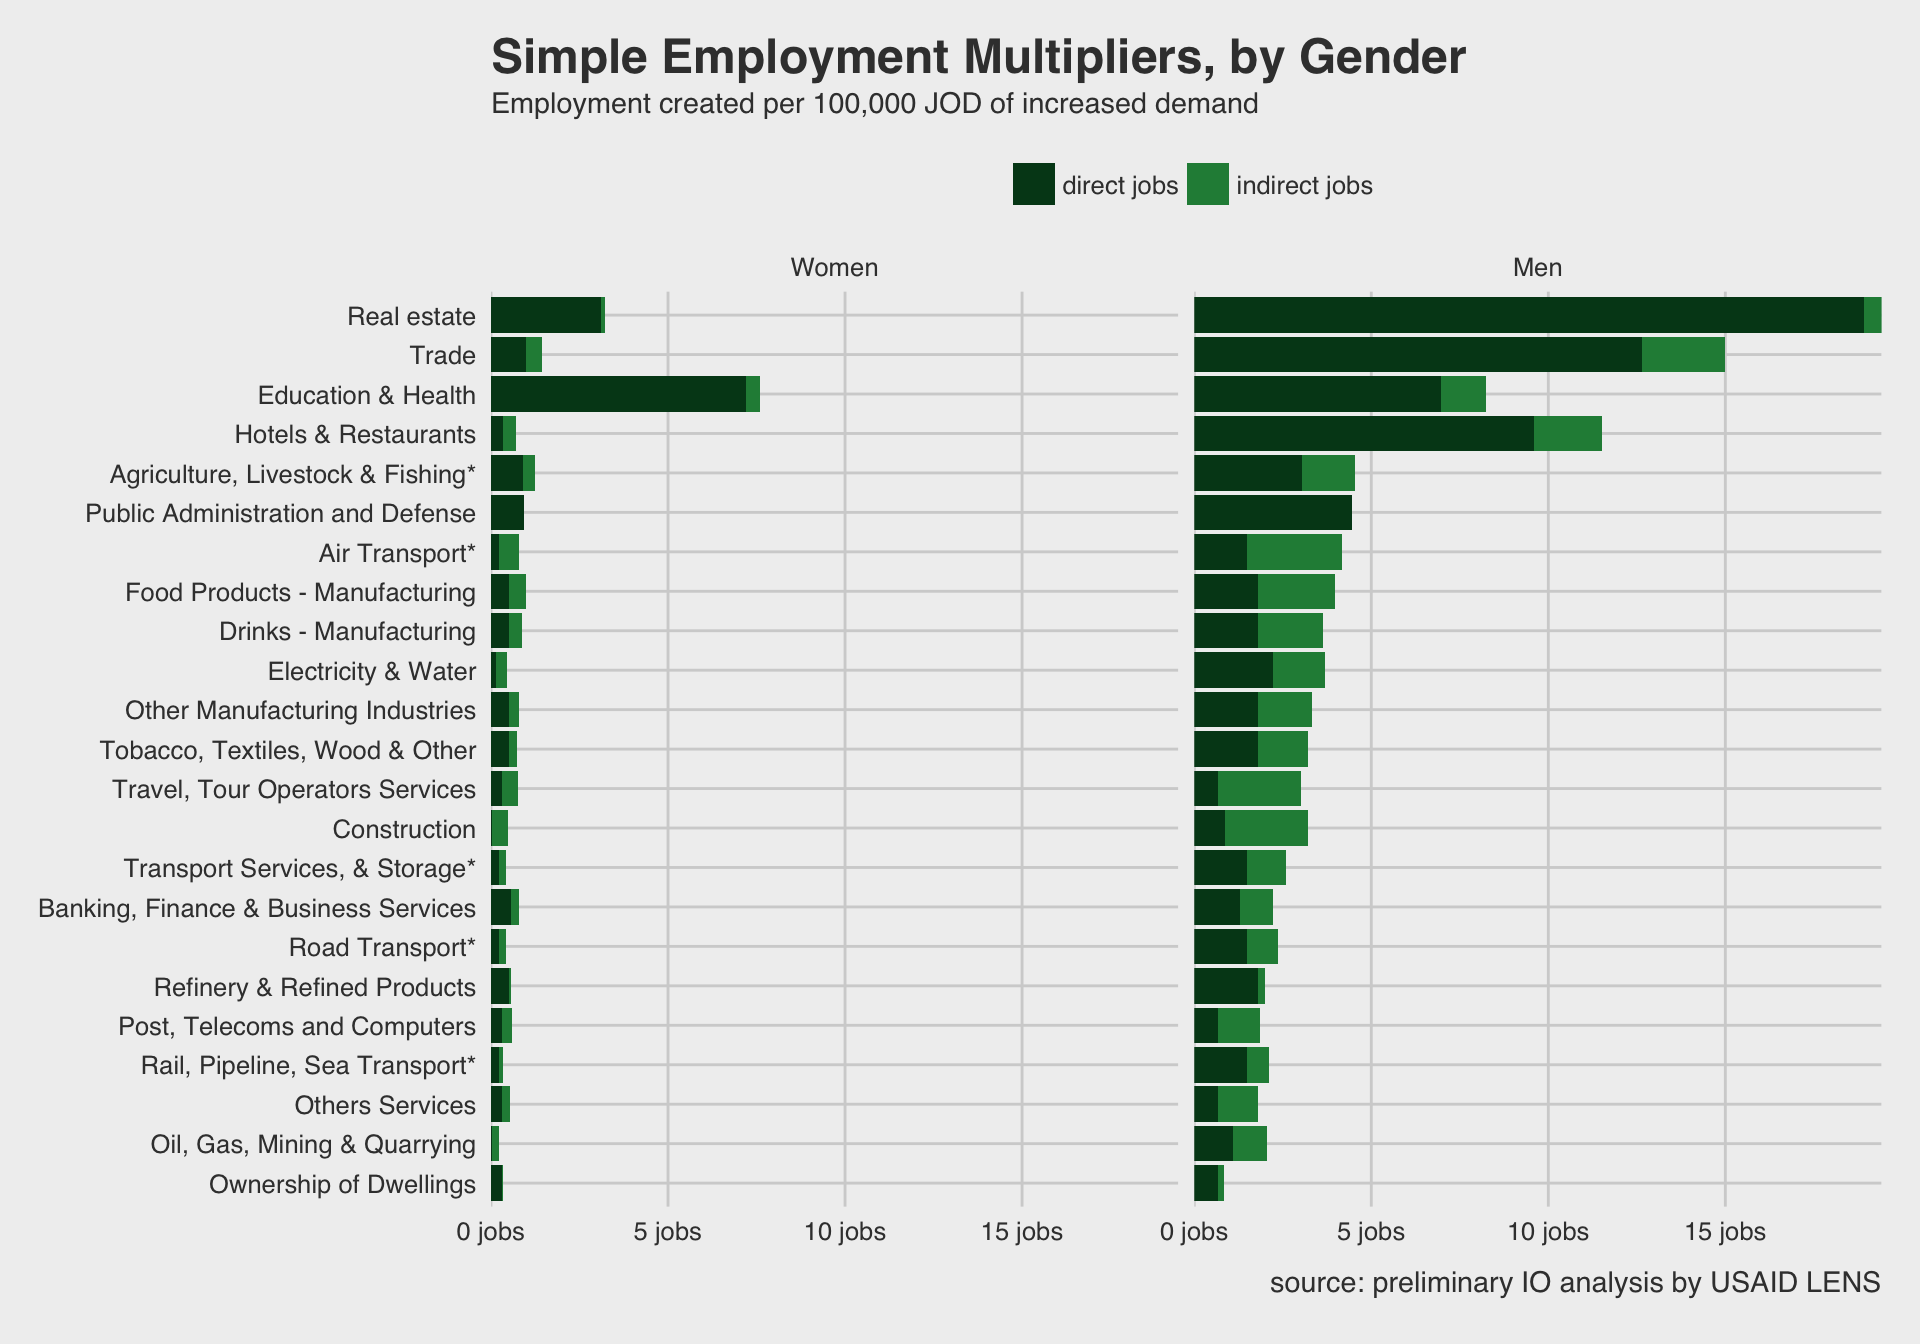
Figure 4.3: Simple employment multiplier, broken out by gender
The impact of each sector can be summarised as follows:
| Sector | female_employment | total_employment | Female Employment Creation | Total Employment Creation | Indirect Revenue Creation |
|---|---|---|---|---|---|
| Real estate | 3.11303 | 22.629 | High | High | Low |
| Trade | 1.00011 | 16.438 | Medium | Medium | Medium |
| Education & Health | 7.18956 | 15.839 | Very High | Medium | Medium |
| Hotels & Restaurants | 0.34591 | 12.232 | Low | Medium | Medium |
| Agriculture, Livestock & Fishing* | 0.91381 | 5.769 | Medium | Low | Medium |
| Public Administration and Defense | 0.92964 | 5.394 | Medium | Low | Low |
| Air Transport* | 0.21590 | 4.968 | Low | Low | High |
| Food Products - Manufacturing | 0.51222 | 4.946 | Low | Low | Medium |
| Drinks - Manufacturing | 0.51222 | 4.513 | Low | Low | Medium |
| Electricity & Water | 0.15172 | 4.146 | Low | Low | Medium |
| Other Manufacturing Industries | 0.51222 | 4.095 | Low | Low | Medium |
| Tobacco, Textiles, Wood & Other | 0.51222 | 3.937 | Low | Low | Medium |
| Travel, Tour Operators Services | 0.31271 | 3.751 | Low | Low | High |
| Construction | 0.02643 | 3.701 | Low | Low | High |
| Transport Services, & Storage* | 0.21590 | 3.028 | Low | Low | Medium |
| Banking, Finance & Business Services | 0.55305 | 3.002 | Low | Low | Medium |
| Road Transport* | 0.21590 | 2.768 | Low | Low | Medium |
| Refinery & Refined Products | 0.51222 | 2.547 | Low | Low | Low |
| Post, Telecoms and Computers | 0.31271 | 2.440 | Low | Low | Medium |
| Rail, Pipeline, Sea Transport* | 0.21590 | 2.432 | Low | Low | Medium |
| Others Services | 0.31271 | 2.319 | Low | Low | Medium |
| Oil, Gas, Mining & Quarrying | 0.04016 | 2.289 | Low | Low | Medium |
| Ownership of Dwellings | 0.31271 | 1.177 | Low | Low | Low |
4.2.0.1 Another Graph
“Employment Support Estimates: Methodological Framework,” Office of Financial Management: Research and Information Paper, november 2009, 18, http://www.treasury.nsw.gov.au/__data/assets/pdf_file/0020/17309/trp09-3_dnd.pdf. ↩
Ibid., 18. ↩